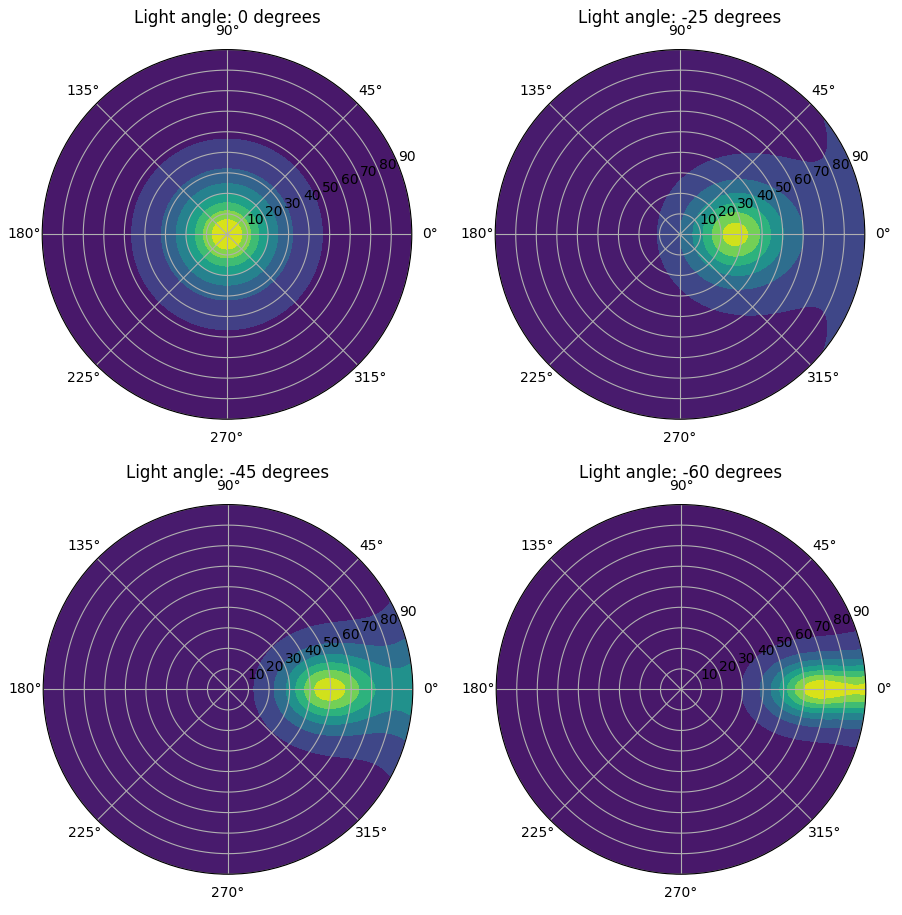
Polar BRDF Plots
This example demonstrates how to sample the BRDFs of materials with the evaluate_brdf() method.
import numpy as np
import matplotlib.pyplot as plt

from raysect.core import Point3D, Vector3D
from raysect.optical.library.metal import RoughAluminium


plt.ion()

origin = Point3D(0, 0, 0)

aluminium = RoughAluminium(0.25)


thetas = np.linspace(-90, 90, 100)
for light_angle in [0, -25, -45, -70]:

    light_position = Point3D(np.sin(np.deg2rad(light_angle)), 0, np.cos(np.deg2rad(light_angle)))
    light_direction = origin.vector_to(light_position).normalise()

    aluminium_brdfs = []
    for theta_step in thetas:
        detector_position = Point3D(np.sin(np.deg2rad(theta_step)), 0, np.cos(np.deg2rad(theta_step)))
        detector_normal = origin.vector_to(detector_position).normalise()
        aluminium_brdfs.append(aluminium.bsdf(light_direction, detector_normal, 500.0))

    plt.plot(thetas, aluminium_brdfs, label='{} degrees'.format(light_angle))

plt.xlabel('Observation Angle (degrees)')
plt.ylabel('BRDF() (probability density)')
plt.legend()
plt.title("The Aluminium BRDF VS observation angle")


def plot_brdf(light_angle):

    light_position = Point3D(np.sin(np.deg2rad(light_angle)), 0, np.cos(np.deg2rad(light_angle)))
    light_direction = origin.vector_to(light_position).normalise()

    phis = np.linspace(0, 360, 200)
    num_phis = len(phis)
    thetas = np.linspace(0, 90, 100)
    num_thetas = len(thetas)

    values = np.zeros((num_thetas, num_phis))
    for i in range(num_thetas):
        for j in range(num_phis):
            theta = np.deg2rad(thetas[i])
            phi = np.deg2rad(phis[j])
            outgoing = Vector3D(np.cos(phi) * np.sin(theta), np.sin(phi) * np.sin(theta), np.cos(theta))
            values[i, j] = aluminium.bsdf(light_direction, outgoing, 500.0)

    fig, ax = plt.subplots(subplot_kw=dict(projection='polar'))
    cs = ax.contourf(np.deg2rad(phis), thetas, values, extend="both")
    cs.cmap.set_under('k')
    plt.title("Light angle: {} degrees".format(light_angle))


plot_brdf(0)
plot_brdf(-25)
plot_brdf(-45)
plot_brdf(-60)

plt.show()

